Walkthrough: Register & Configure an App via the UI
This walkthrough covers two things that happen in the global server frontend:
- Registering a new app — creating the platform entry that gives your app its ID
- Configuring the app interface — defining hyperparameters, inputs, and outputs through the UI instead of (or
alongside)
app.yml
Step 1 – Open the Tool Development
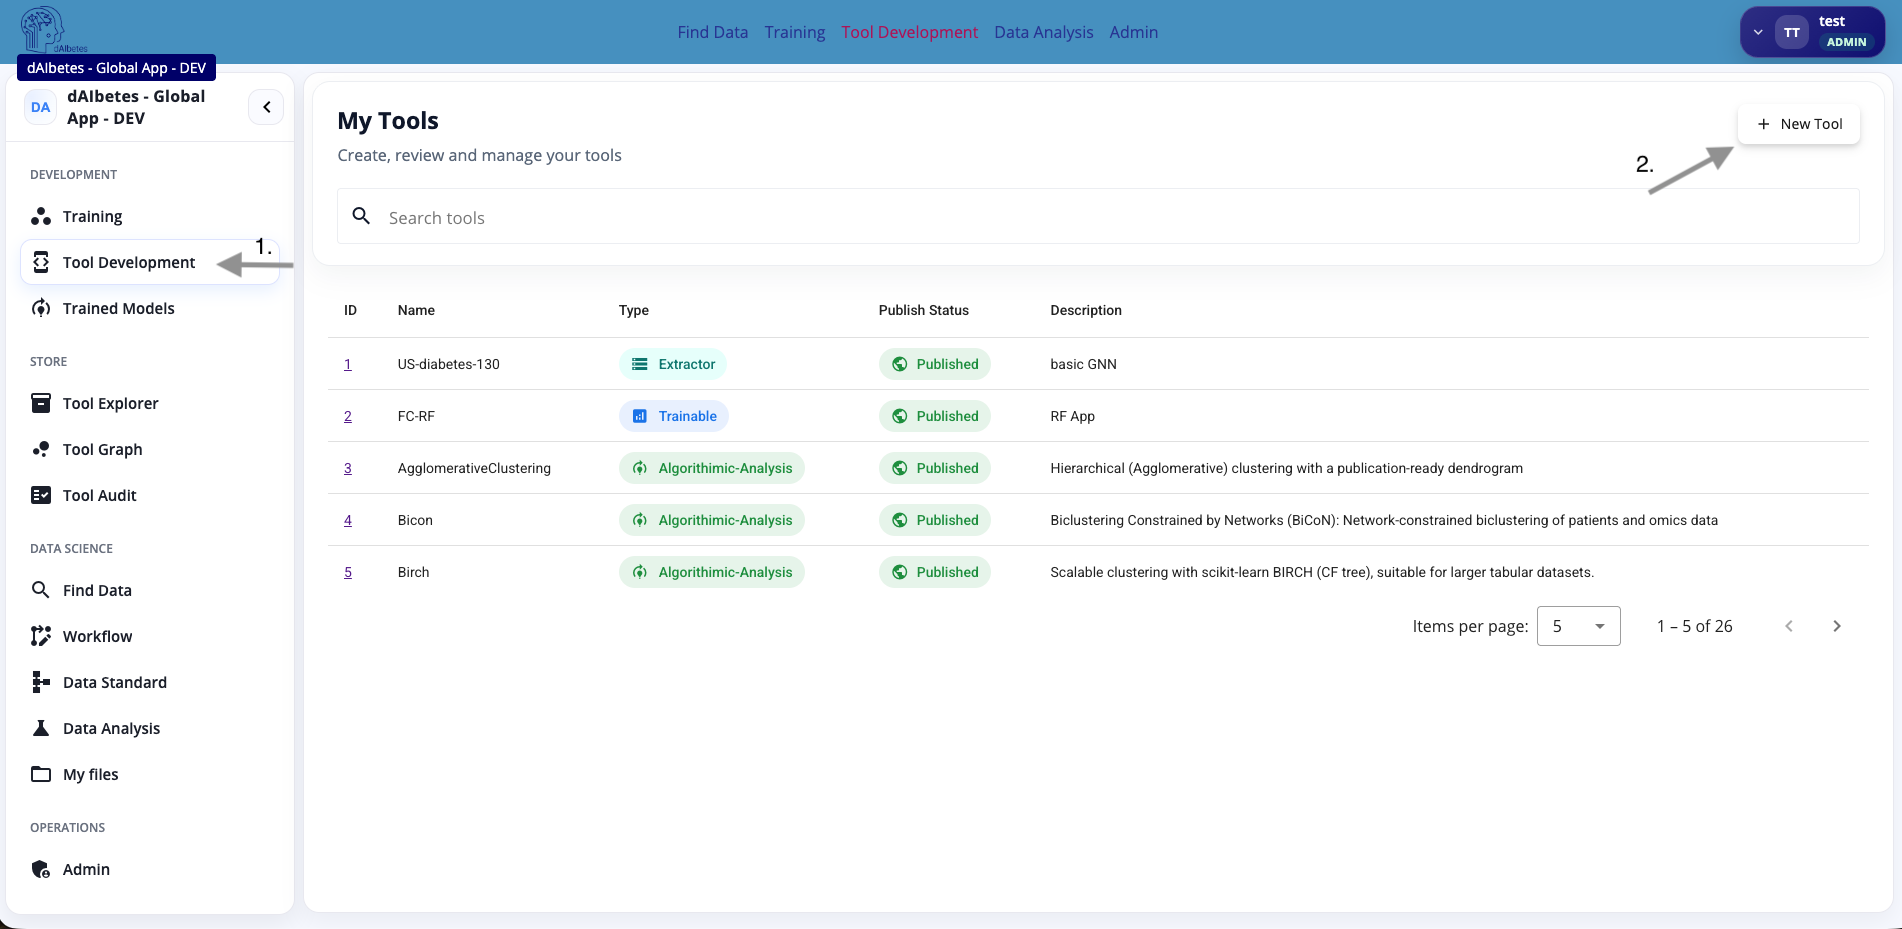
Navigate to the global server frontend and click Tool Development in the top navigation (or go directly to /app).
You will see a list of all yours tools. Each entry shows the app id, name, type, publish status and a short description.
What to capture: The /app page showing your tools and the New Tool button in the top right corner.
Step 2 — Open the Registration Form
Click New Tool in the top right. A form appears with the following fields:
| Field | What to enter |
|---|---|
| Name | Human-readable display name, e.g. My Readmission App |
| Slug | Unique URL-safe identifier, e.g. my-readmission-app |
| Short Description | One sentence describing what the app does |
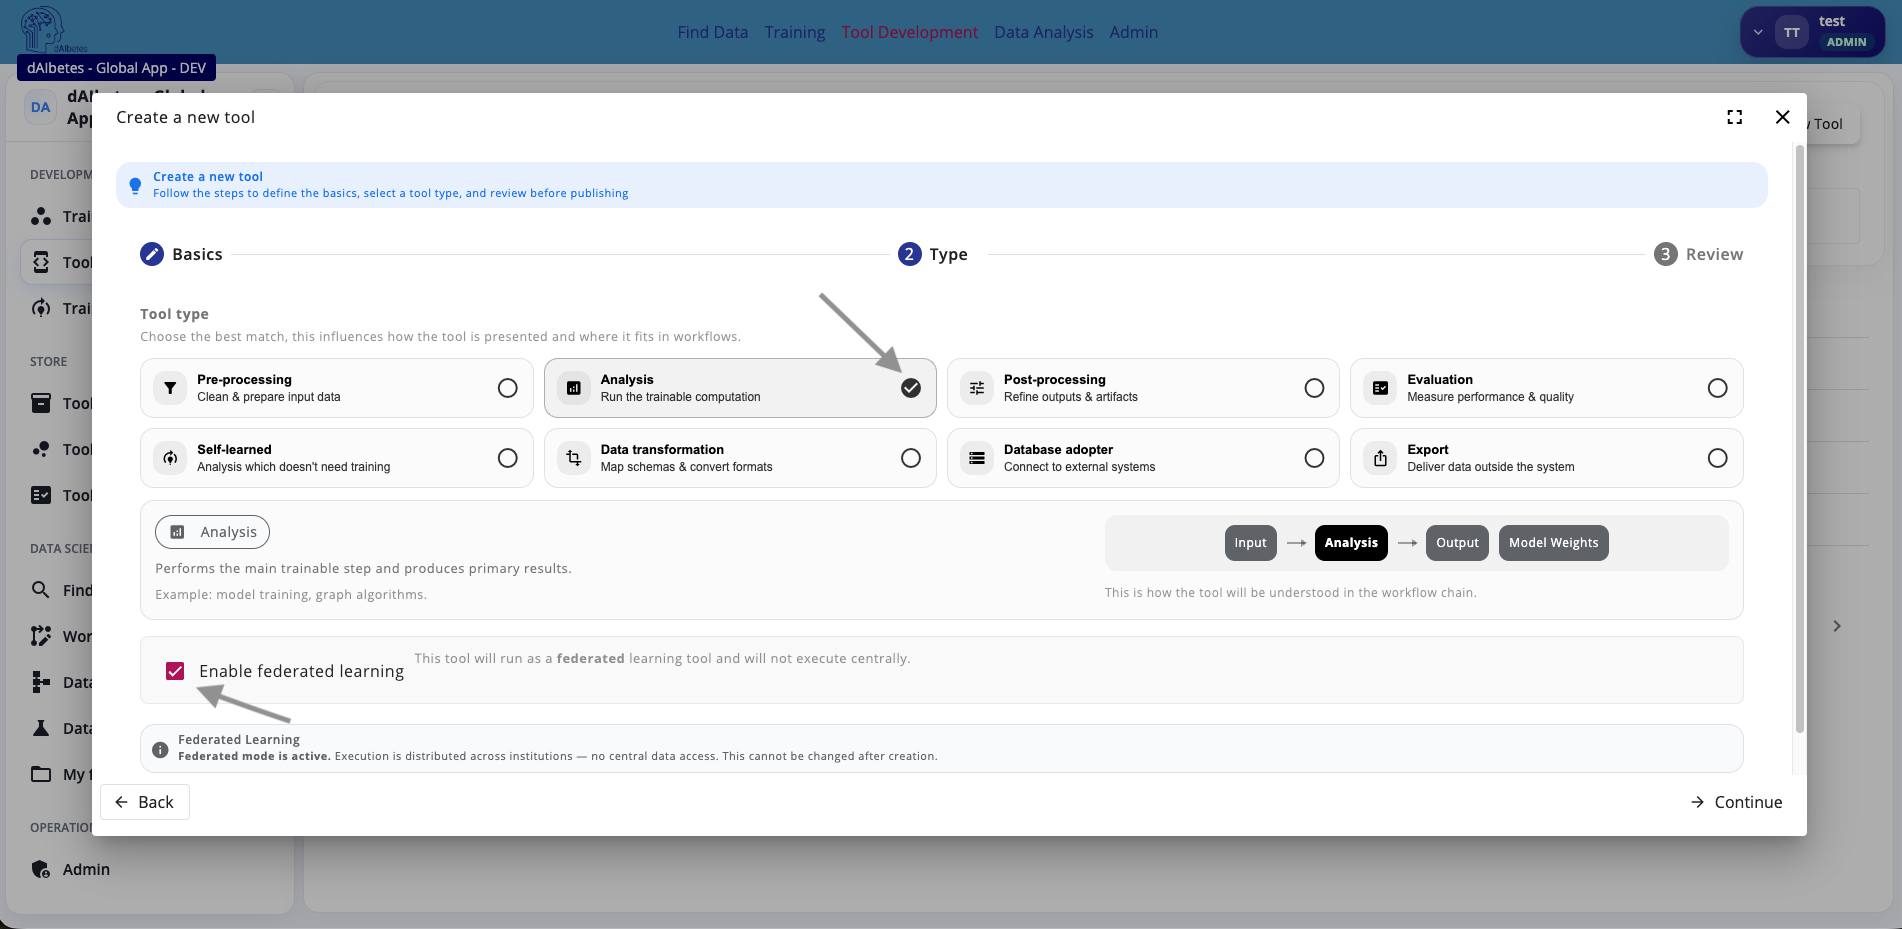
| Tool Type | Select ANALYSIS for a machine learning training/prediction app |
What to capture: The New Tools registration form with example values filled in for all fields.
Make sure App Type dropdown is open or shows the selected value ANALYSIS and you enable federated learning.
Step 3 — Submit and Note the App ID
Click Ceate Tool. The platform creates the tool entry and routes you to the detail page for your new app.
Copy the Tool ID. You need it in your .env file as APP_ID=27. Without it your app container cannot authenticate to
the platform.
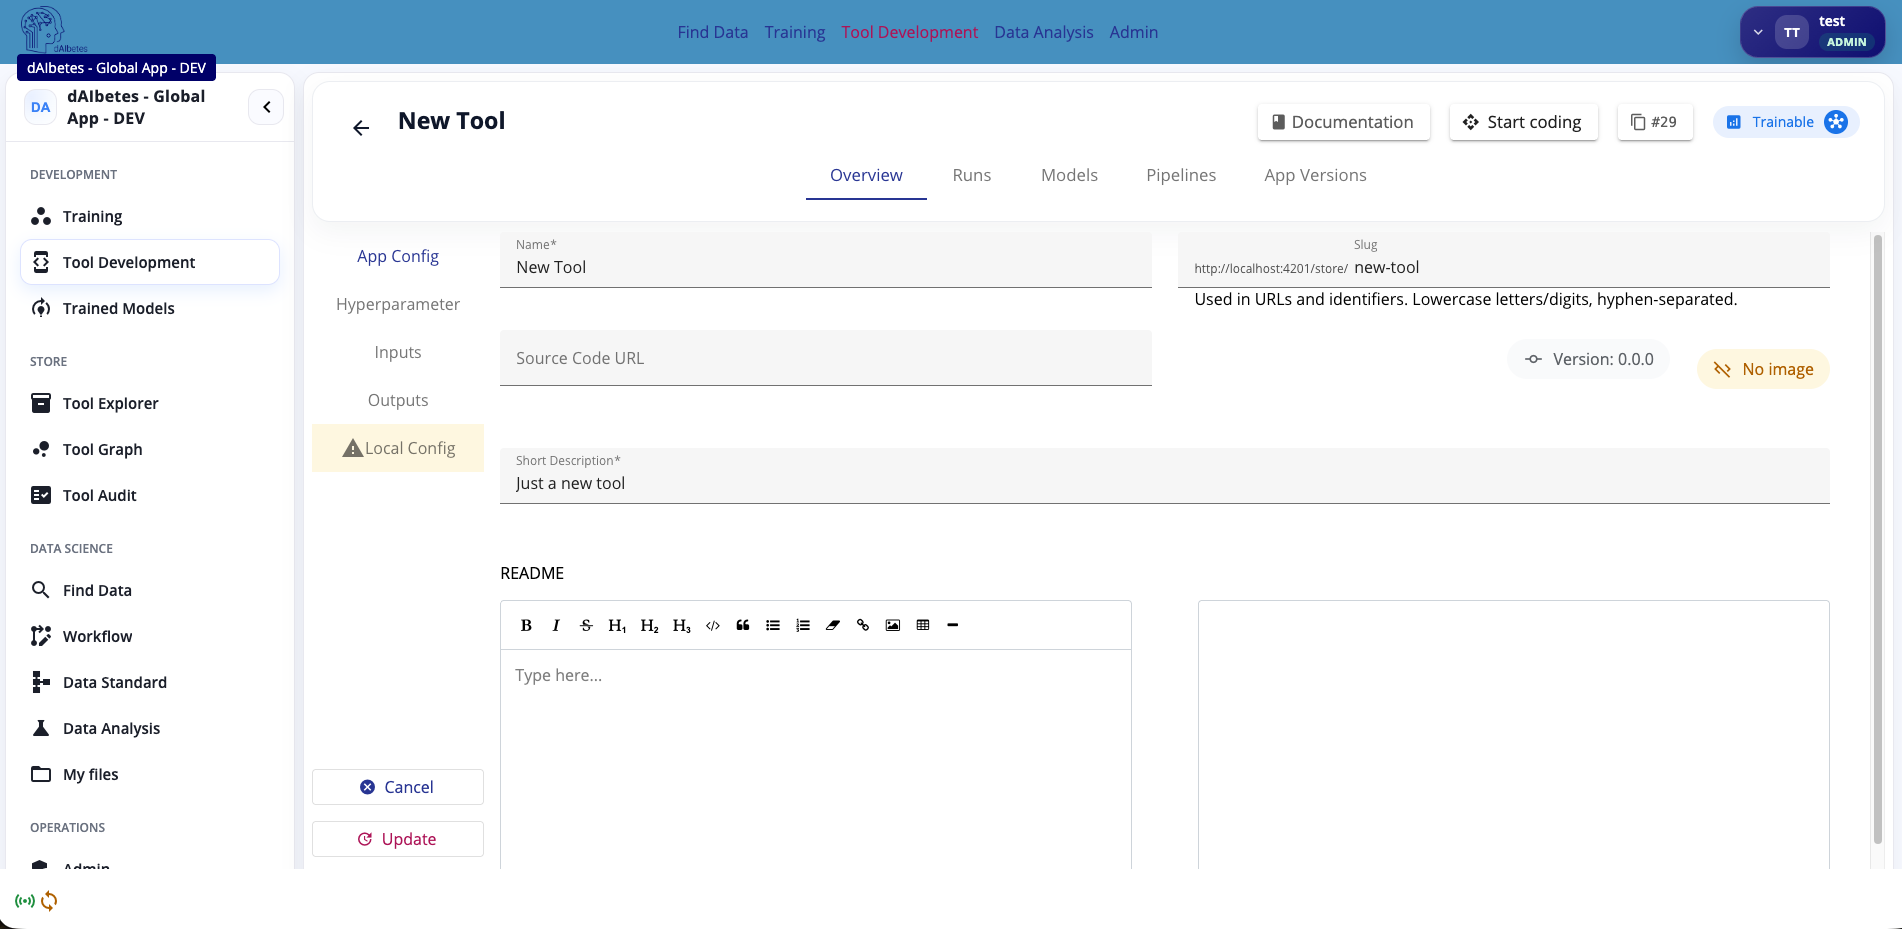
Click on Start coding to open the code a wizard, where you can create a customized app skeleton.
Step 4 — Open the App Detail Page
After registration, click on your app name or select it from the tool list to open the app detail page.
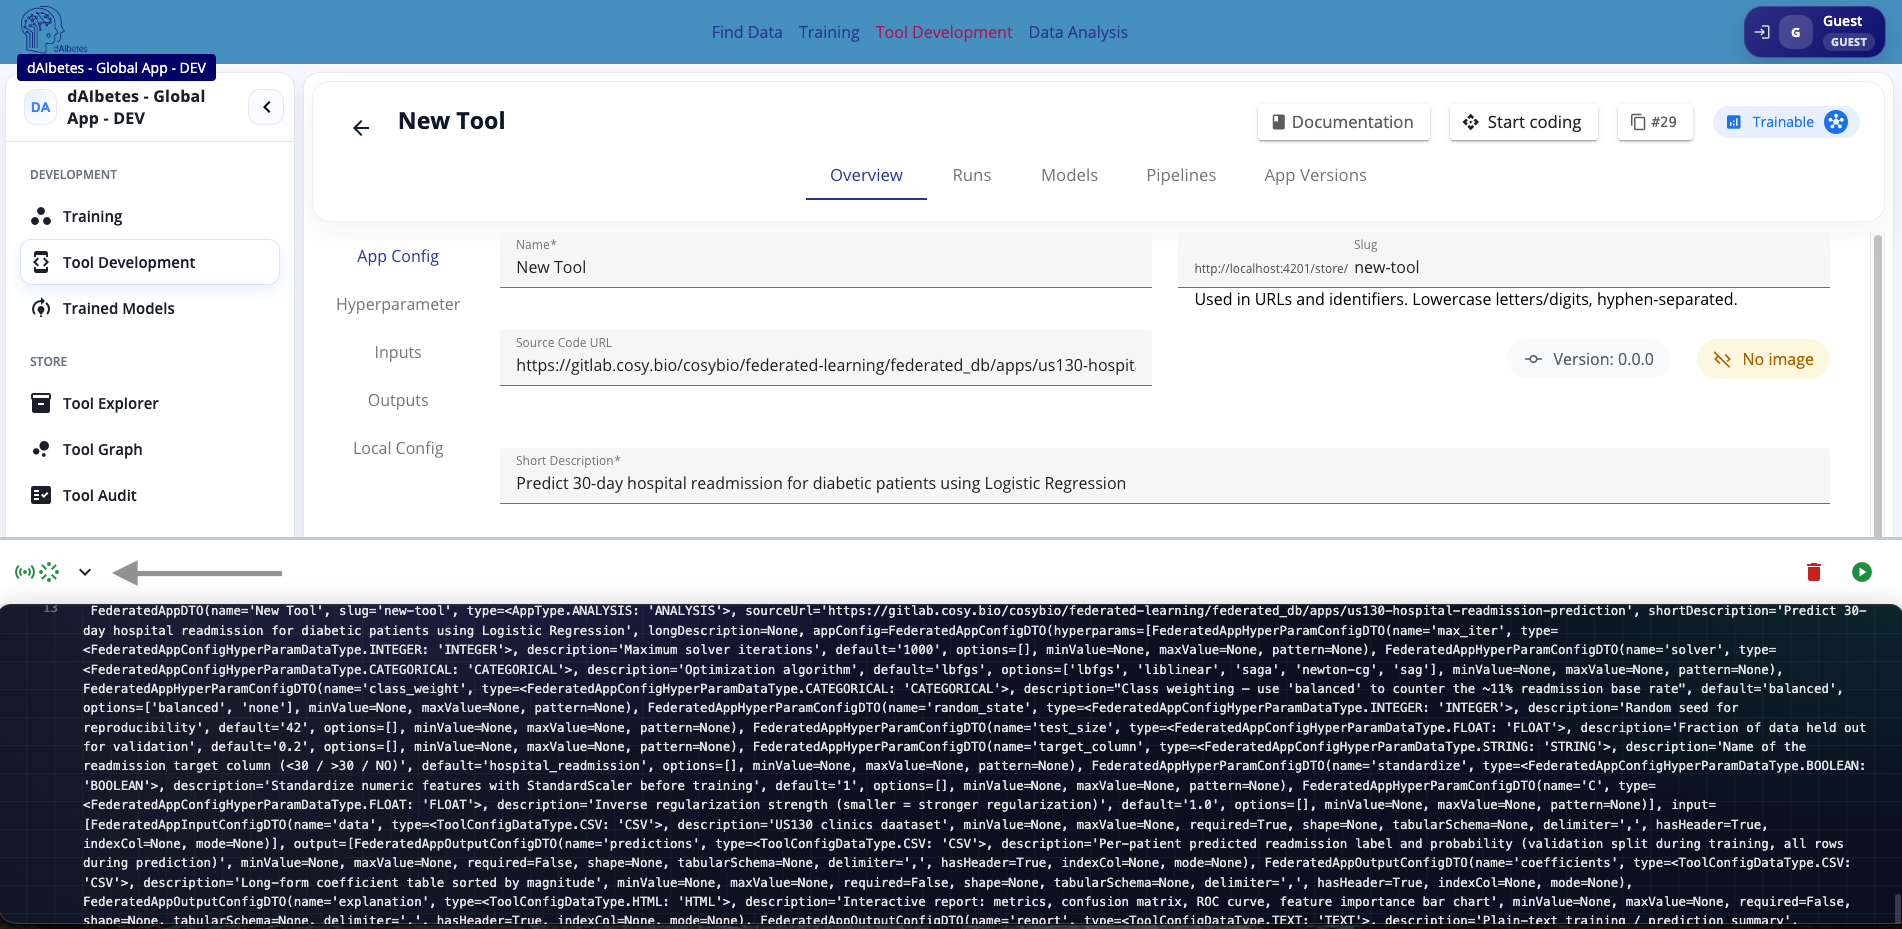
The detail page provides the central workspace for inspecting and editing the registered tool. In the header area, you can see the tool name, available actions such as Documentation and Start coding, the current app version, and whether a container image is already available. The tab bar gives access to the main tool sections:
- Overview — general app metadata, source repository, slug, description, README, and local configuration
- Runs — history of training or prediction executions
- Models — trained model artifacts associated with the tool
- Pipelines — build and validation pipeline information
- App Versions — published and versioned app states
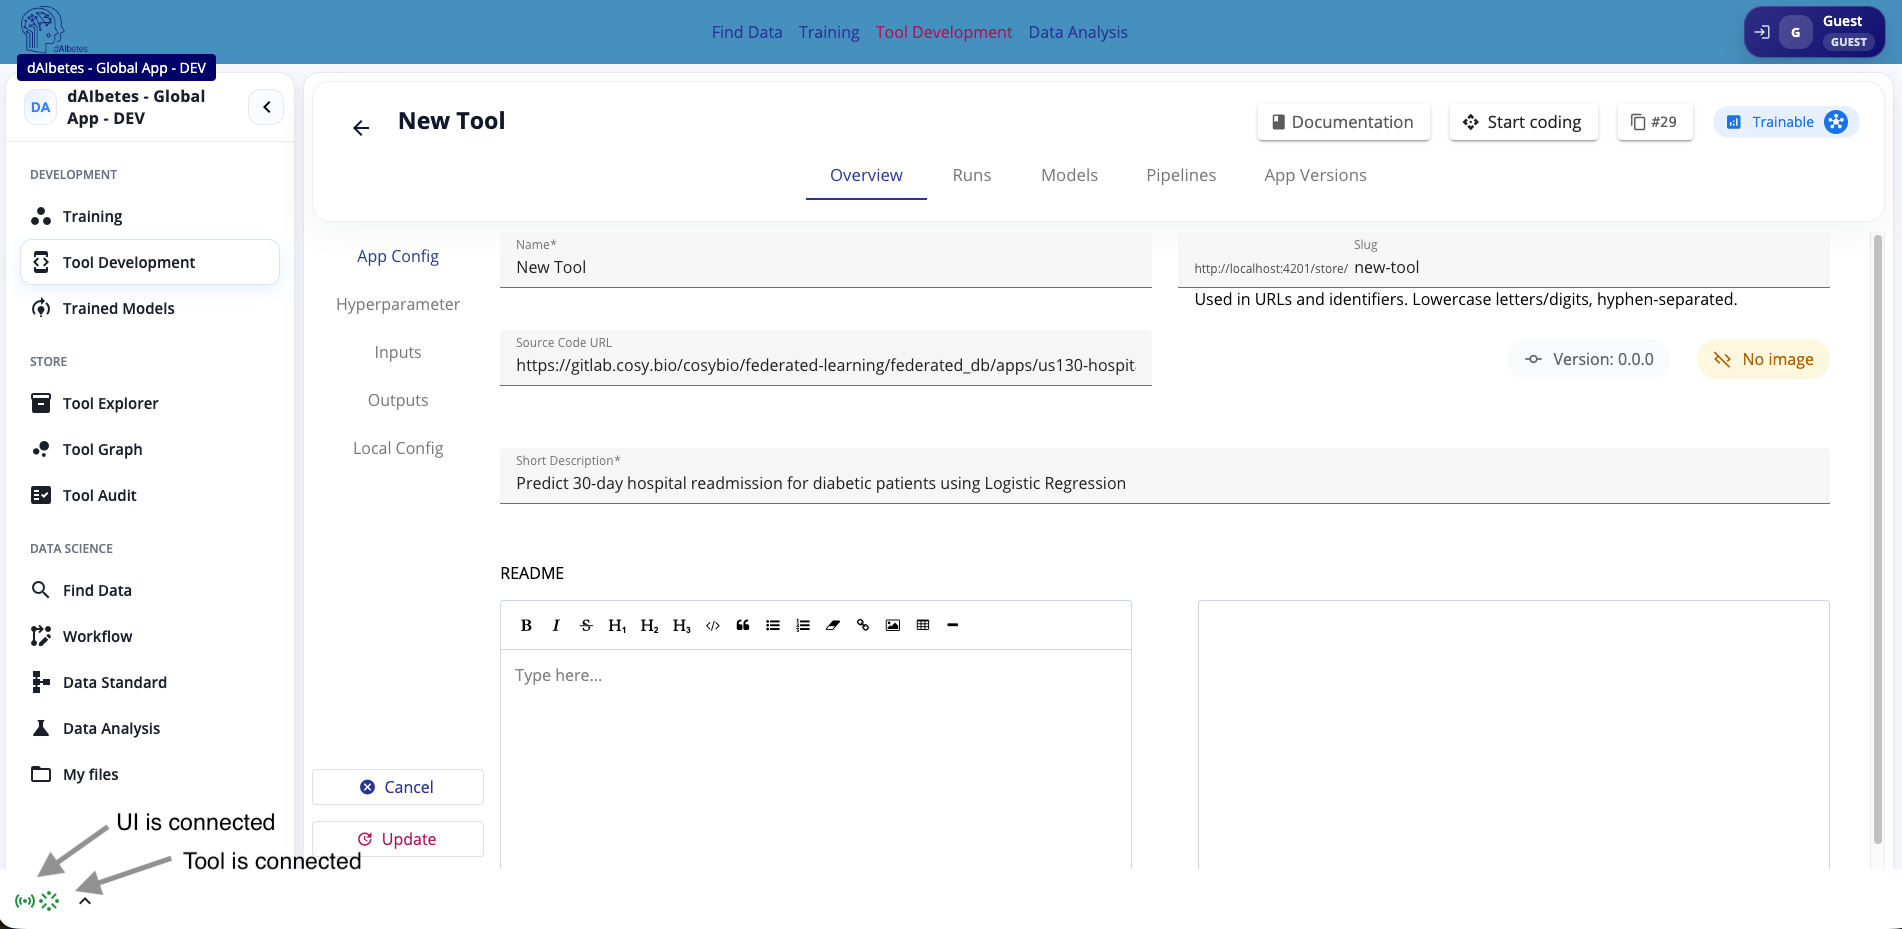
At the bottom-left corner, the connection indicator shows whether the coding environment is connected to the app.
When the right indicator button is green, the app is connected. In this state, you can open the log window and
inspect the live app configuration. Configuration is synchronized bidirectionally: changes made in the UI are reflected
in the code-side configuration, and changes made in the code configuration file, such as app.yml, are reflected back
in the UI. This means it does not matter whether you adjust the configuration through the graphical interface or
directly in code.
Step 5 — Configure Hyperparameters via the UI
Open the Hyperparameter section in the app detail page. This section shows all hyperparameters currently defined for
the app. If you registered a fresh app without uploading an app.yml yet, the list may initially be empty.
To add or edit a hyperparameter, use the edit/create view in the hyperparameter card. Each hyperparameter definition is mapped to the app configuration class and can later be used directly inside your tool code.
For each hyperparameter, you define:
| Field | Description |
|---|---|
| Mode | Defines where the parameter is used, for example during training, prediction, or both |
| Name | The field name that maps to your AppConfig dataclass, e.g. max_iter |
| Input Data Type | The parameter type, for example INTEGER, FLOAT, BOOLEAN, STRING, or CATEGORICAL |
| Default | The default value used when no user-specific value is provided |
| Description | Help text shown in the UI and documentation |
| Options | For categorical parameters only — the list of valid values |
| Min Value / Max Value | Optional validation bounds for numeric parameters |
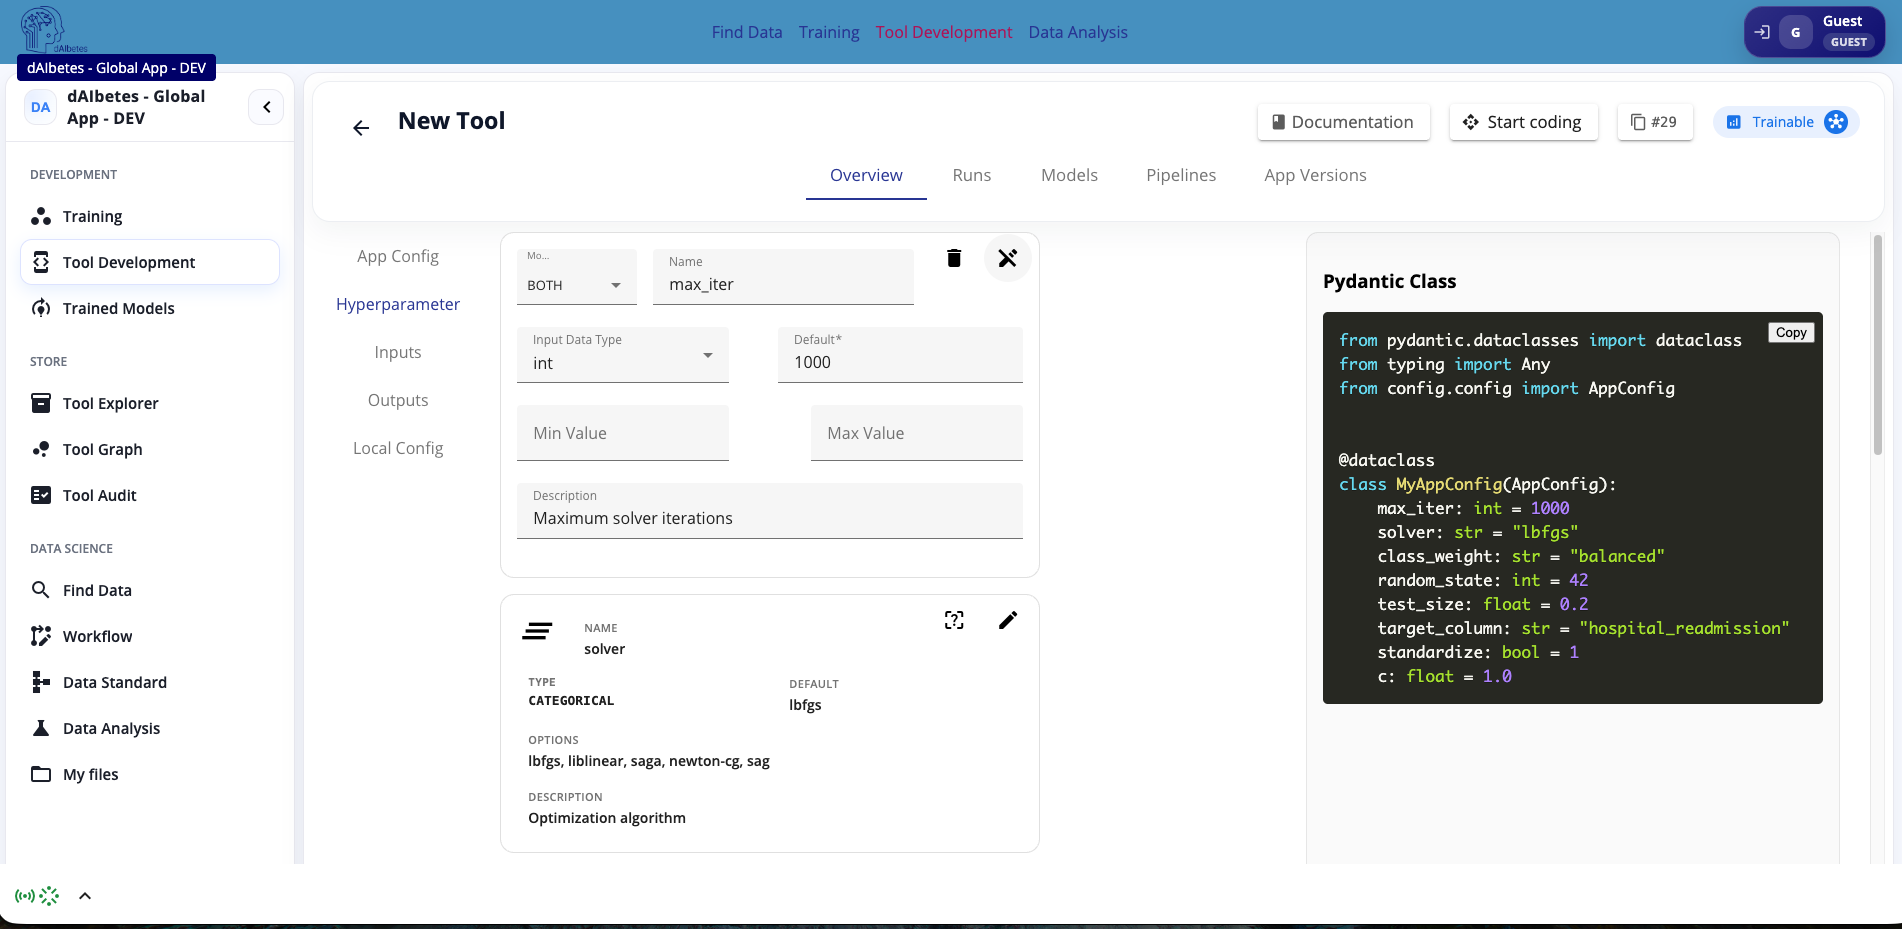
Hyperparameter definitions are synchronized with the tool configuration. Changes made in the UI are written back to the
tool configuration file, such as tool.yml, and changes made in the code-side configuration are reflected back in the
UI.
After creating a hyperparameter, you can switch to the test value view. This allows you to enter a sample value and immediately validate whether the configured type, options, and validation constraints behave as expected.
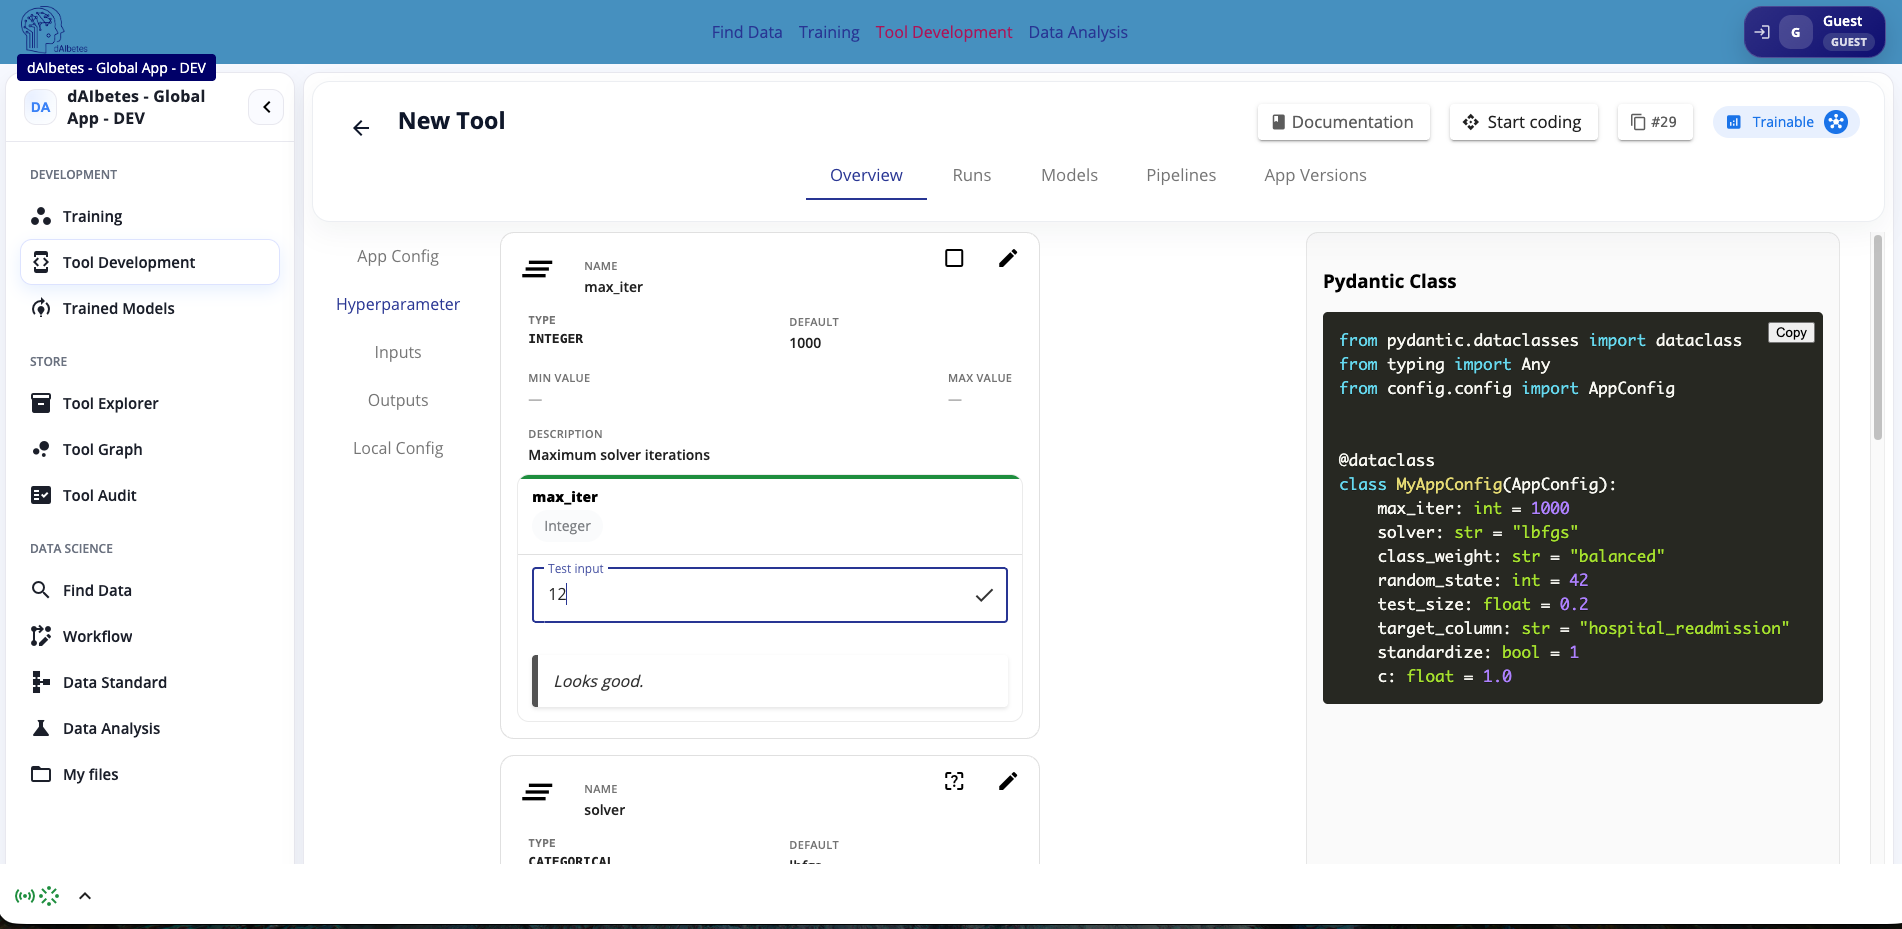
Add the following hyperparameters for the US-130 readmission app, or define equivalent parameters for your own tool:
| Name | Type | Default | Notes |
|---|---|---|---|
max_iter | INTEGER | 1000 | Maximum number of solver iterations |
solver | CATEGORICAL | lbfgs | Options: lbfgs, liblinear, saga, newton-cg, sag |
class_weight | CATEGORICAL | balanced | Options: balanced, none |
C | FLOAT | 1.0 | Inverse regularization strength |
test_size | FLOAT | 0.2 | Fraction of data held out for validation |
standardize | BOOLEAN | 1 | Enables or disables feature scaling |
target_column | STRING | hospital_readmission | Name of the target column |
On the right side of the page, the generated Pydantic Class preview shows how the UI configuration is translated into the app-side configuration class. This helps verify that the hyperparameters are correctly represented before using them in the tool implementation.
Step 6 — Configure Inputs and Outputs
In the same app detail page, open the Inputs section to define which files or data objects the tool expects. Then open the Outputs section to define which result files the tool will produce.
Inputs and outputs are part of the app contract. They describe how the platform passes data into the tool and how generated artifacts are returned after execution.
Configure the input
For the US-130 readmission app, add one CSV input:
| Field | Value |
|---|---|
| Name | data |
| Input Data Type | CSV |
| Required | Yes |
| Description | US130 clinics dataset |
| Delimiter | , |
| Has Header | Yes |
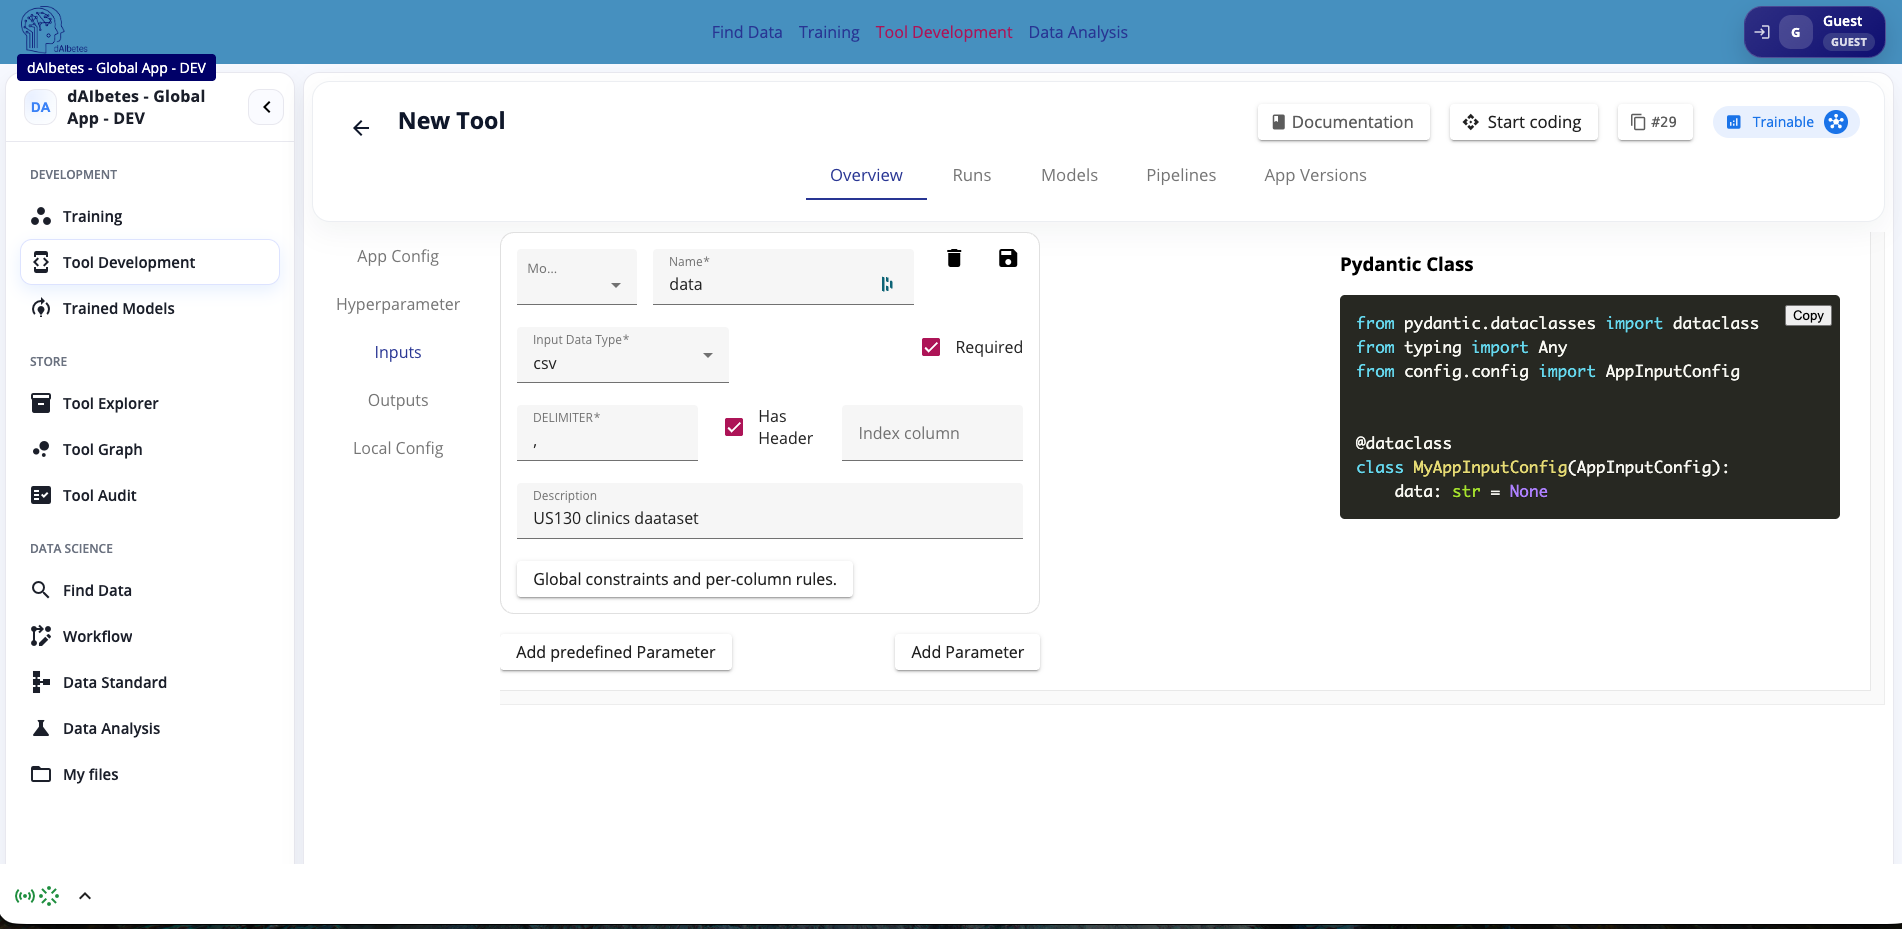
For tabular files such as CSV files, you can also define global constraints and per-column rules through the Tabular schema dialog. This allows you to describe the expected structure of the input file, including row and column constraints, required columns, numeric-only constraints, and rules for prohibited null values.
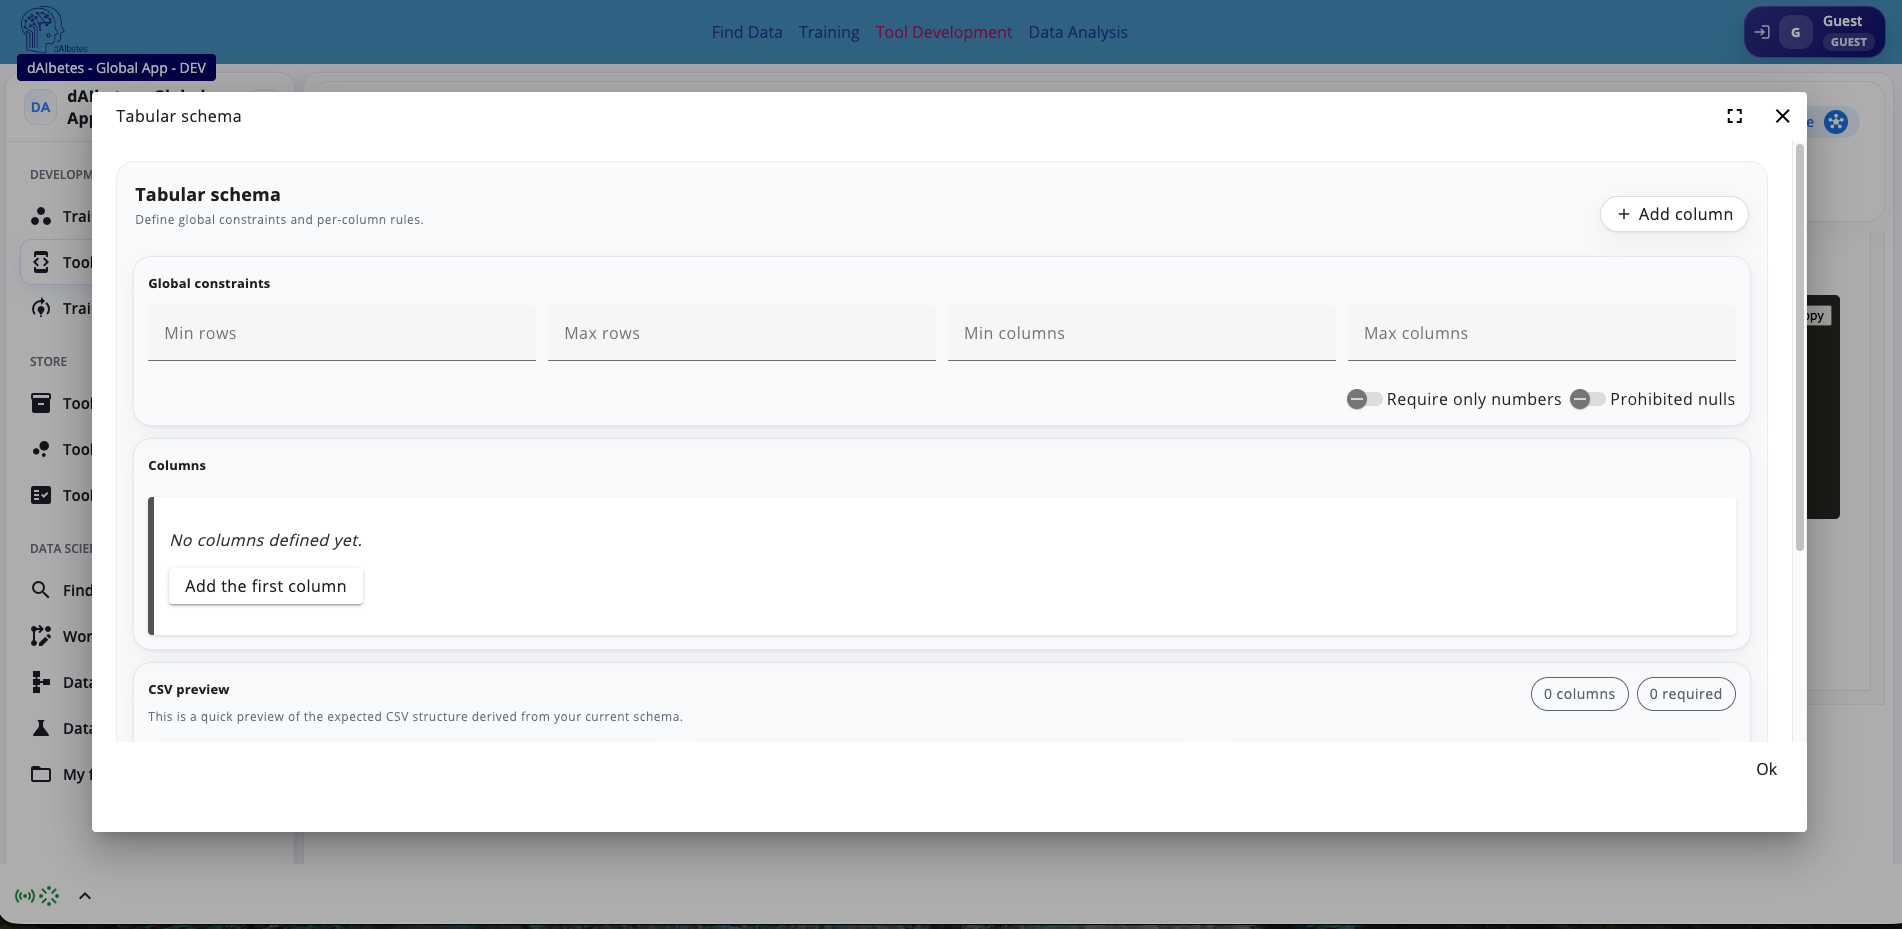
Input definitions and validation rules are synchronized with the tool configuration file, such as tool.yml. Changes made in the UI are reflected in the code-side configuration, and changes made in the configuration file are reflected back in the UI.
Configure the outputs
Next, open the Outputs section and define the files generated by the tool. For the US-130 readmission app, add the following outputs:
| Name | Type | Description |
|---|---|---|
predictions | CSV | Per-patient predicted readmission label and probability |
coefficients | CSV | Long-form coefficient table sorted by magnitude |
explanation | HTML | Interactive report with metrics, confusion matrix, ROC curve, and feature importance |
report | TEXT | Plain-text training or prediction summary |
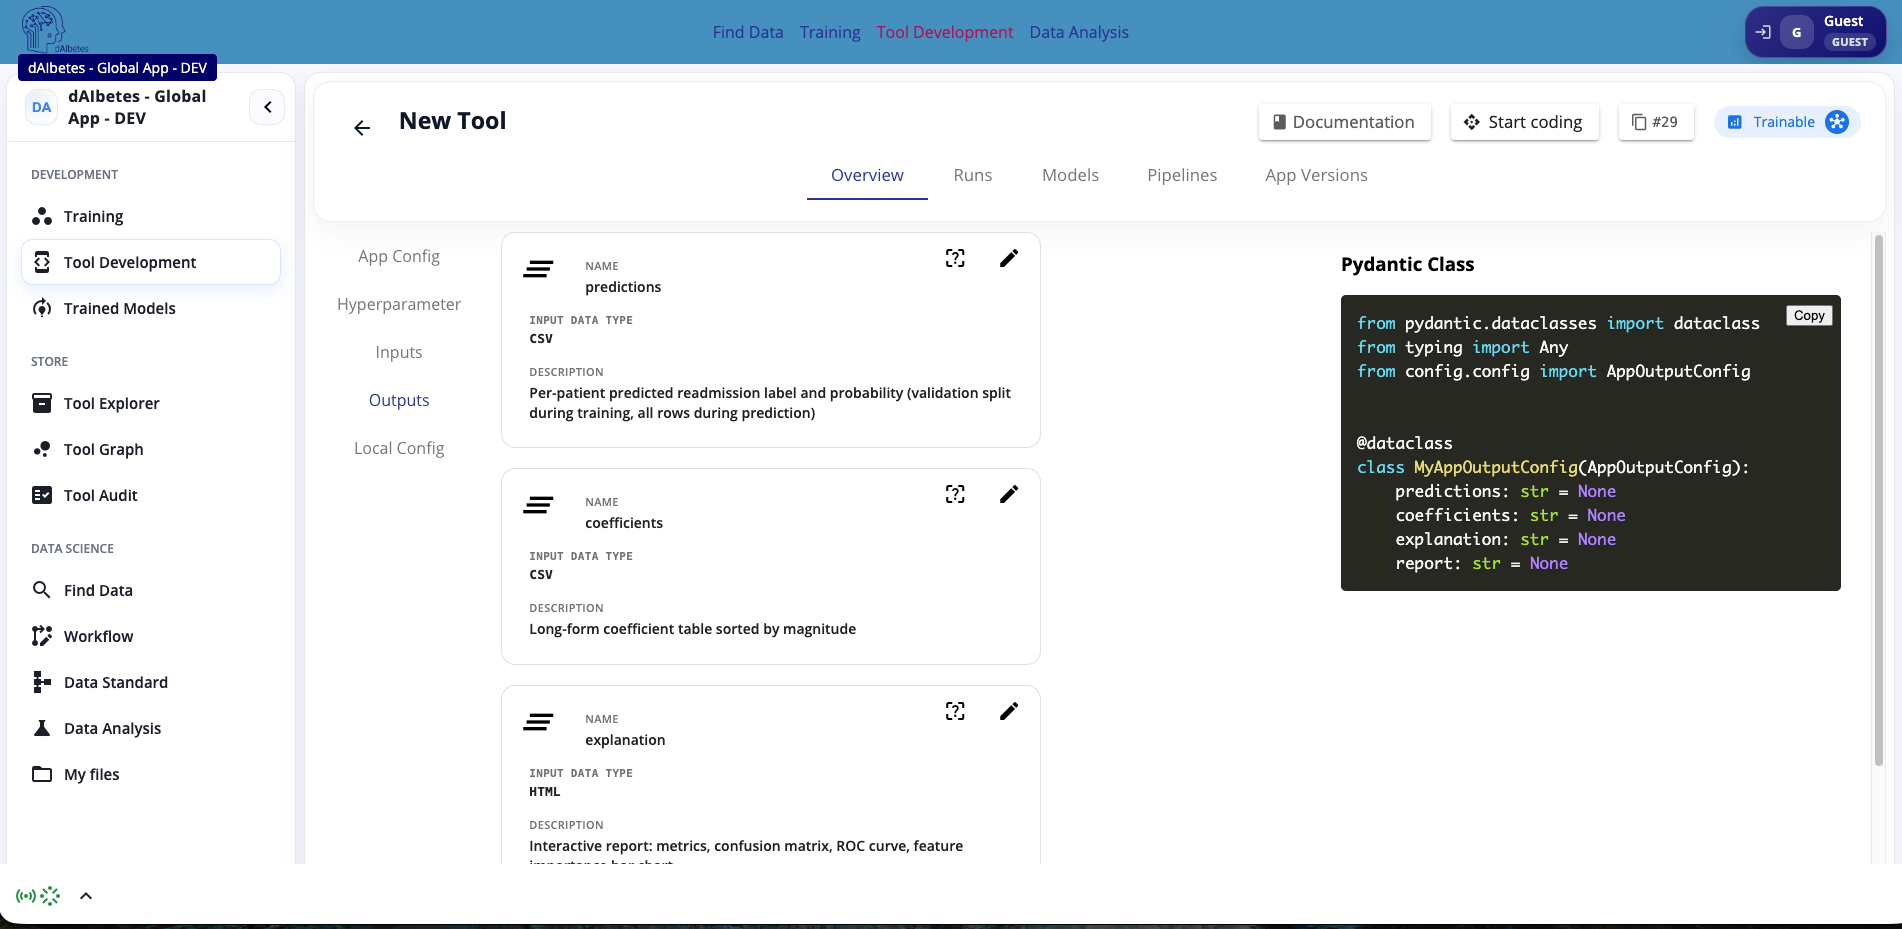
On the right side of the page, the generated Pydantic Class preview shows the corresponding input or output configuration class. You can copy this class directly into the tool source code and use it as the typed configuration interface for your app implementation.
Step 7 — Review Local Configuration and Test Files
Open the Local Config section in the app detail page. This section shows the local client-side configuration used while developing and testing the tool.
Here you can review settings such as:
| Field | Description |
|---|---|
| APP Key | The local key used to identify and connect the app client |
| Enable Config SYNC | Indicates whether configuration changes are synchronized between the UI and the local tool configuration |
| Trace Performance | Enables or disables local performance tracing during development |
| Data Files | Shows how many local files are available for testing |
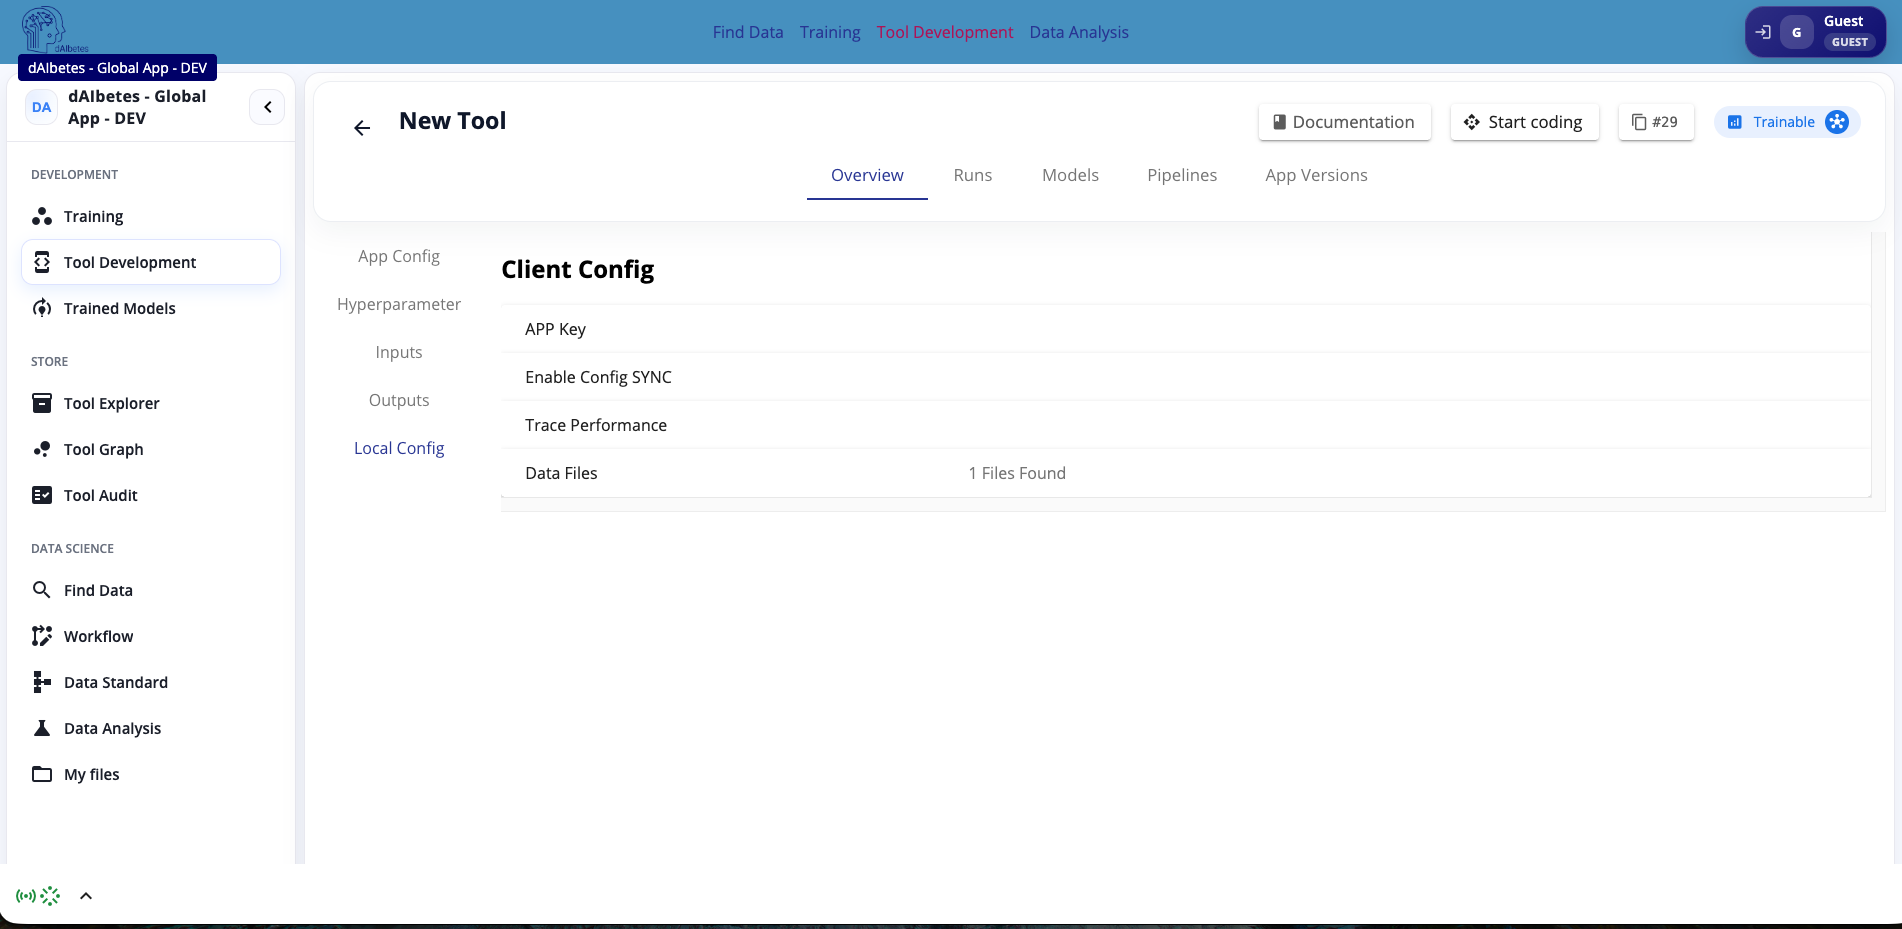
The Data Files entry allows you to inspect files that are available locally for testing. These files can be used to validate input definitions, test schema assumptions, and run the tool during development before publishing a final app version.
When a local tabular file is available, the UI can display a structured preview of its content. The preview summarizes the detected columns, missing values, inferred data categories, and column-level characteristics. This helps verify whether the file matches the input contract defined in the Inputs section.
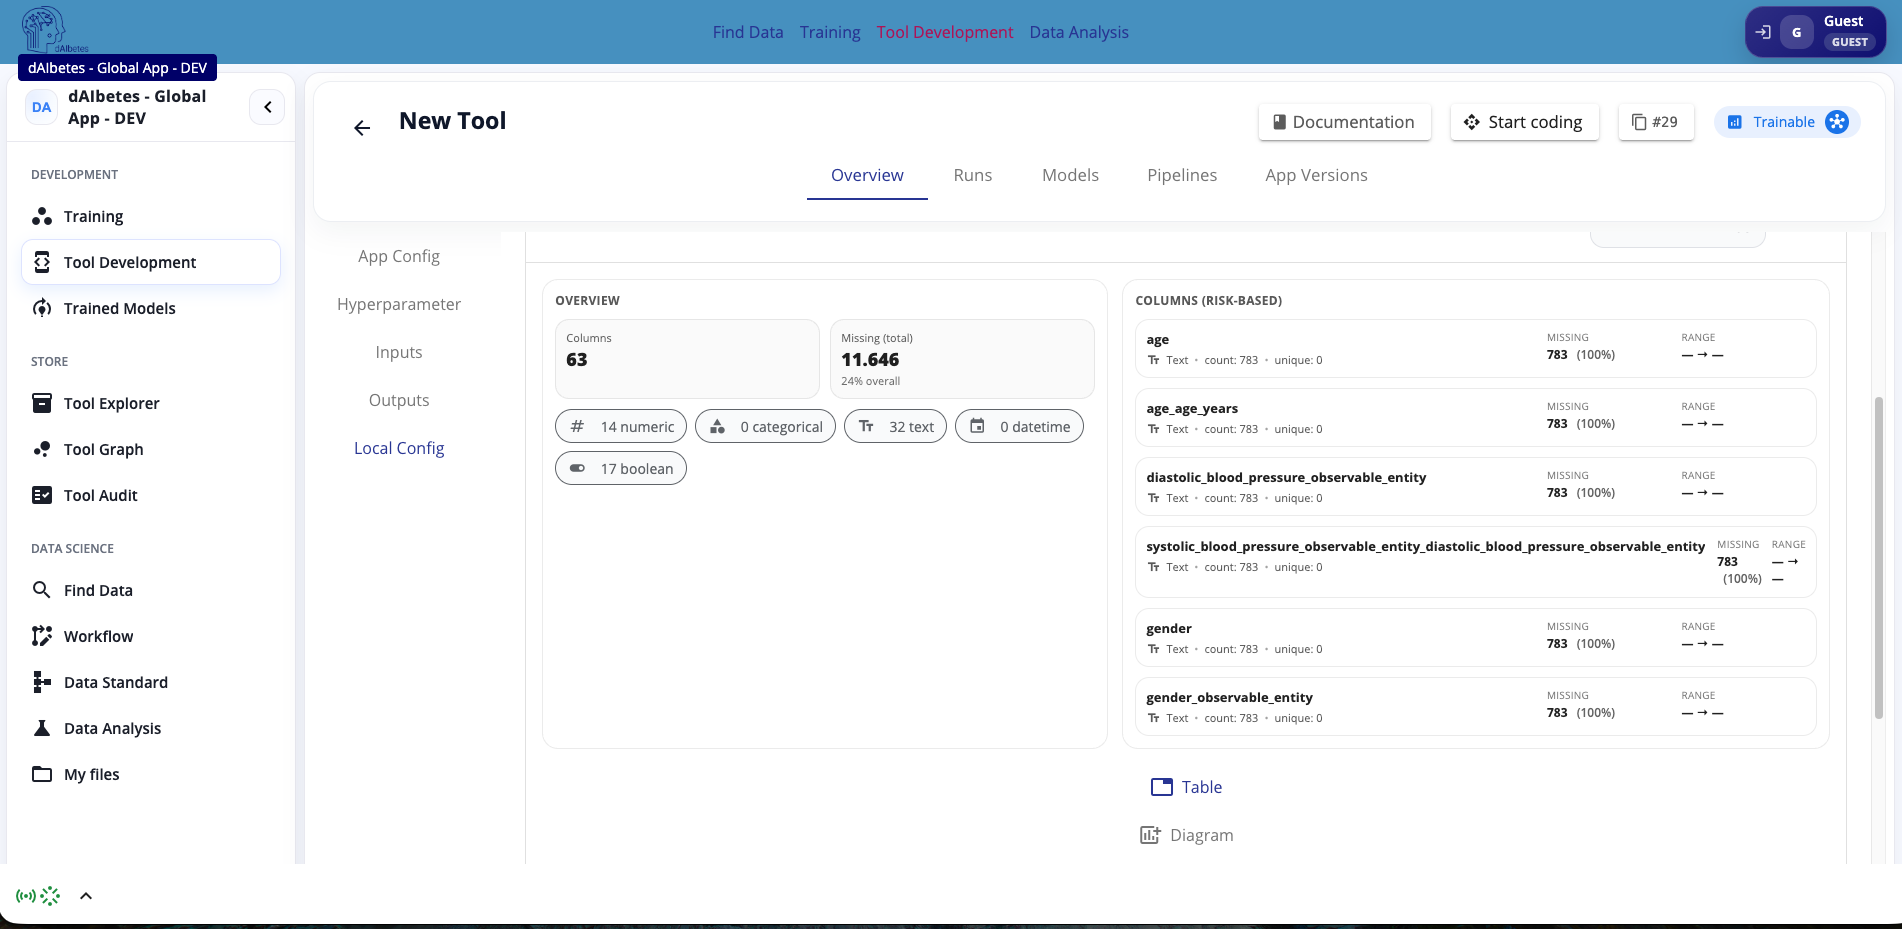
Local configuration and local test files are especially useful while the app is connected to the development client. They allow you to check whether the UI configuration, tool.yml, and local test data are aligned before running or publishing the tool.
UI vs app.yml — When to Use Which
| Situation | Recommended approach |
|---|---|
| Active development — changing the interface often | Use app.yml with PRIO_LOCAL_CONFIG=true |
| Stable interface, non-technical team members configuring defaults | Use the UI |
| Sharing a finalized app version | Set PRIO_LOCAL_CONFIG=false and keep UI as source of truth |
| Automated CI/CD deployment | Push app.yml and sync via ENABLE_CONFIG_SYNC=true |
When PRIO_LOCAL_CONFIG=true in your .env, your local app.yml always wins over what is in the database — even
if you edited the UI. When PRIO_LOCAL_CONFIG=false, the platform database version wins.